More competition, and a wall just under the threshold
We read every public contract published in SEAO since 2021. Two findings stand out: open public calls draw more bidders than in 2022, and gré à gré contracts pile up just under the amount at which a public body must call for public tenders.
 By Philippe Dallaire, founder of Offra · published September 26, 2026 · how we measured
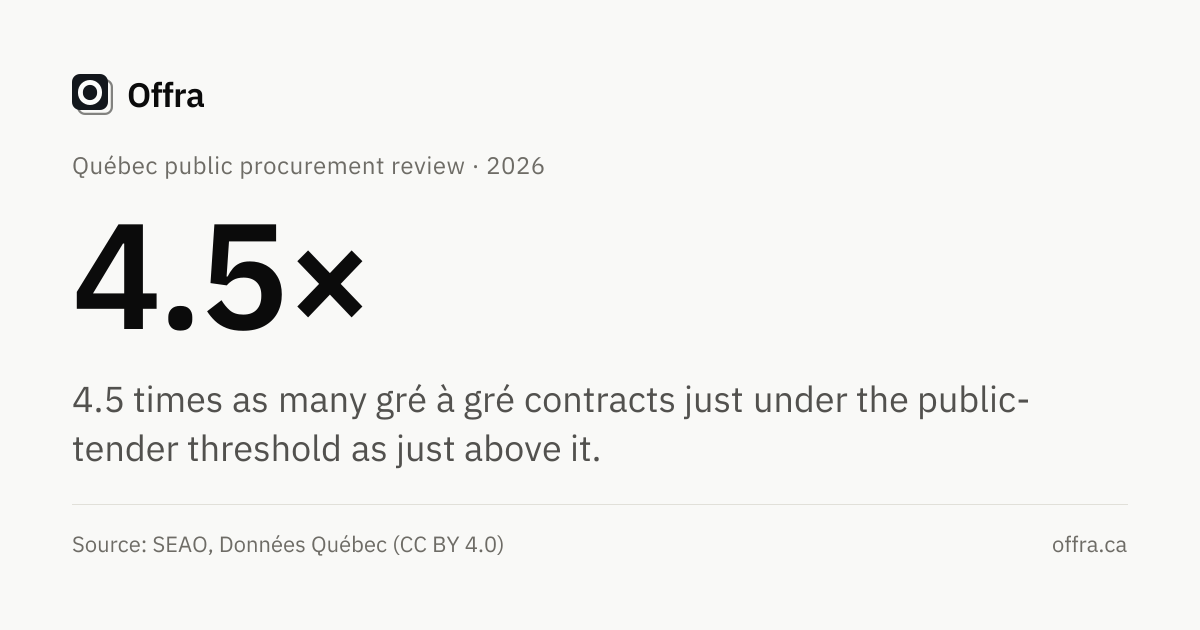
Provincial public bodies, 2024-2025: single-award gré à gré contracts in the $4,000 below the $133,800 threshold, relative to those in the $4,000 above.
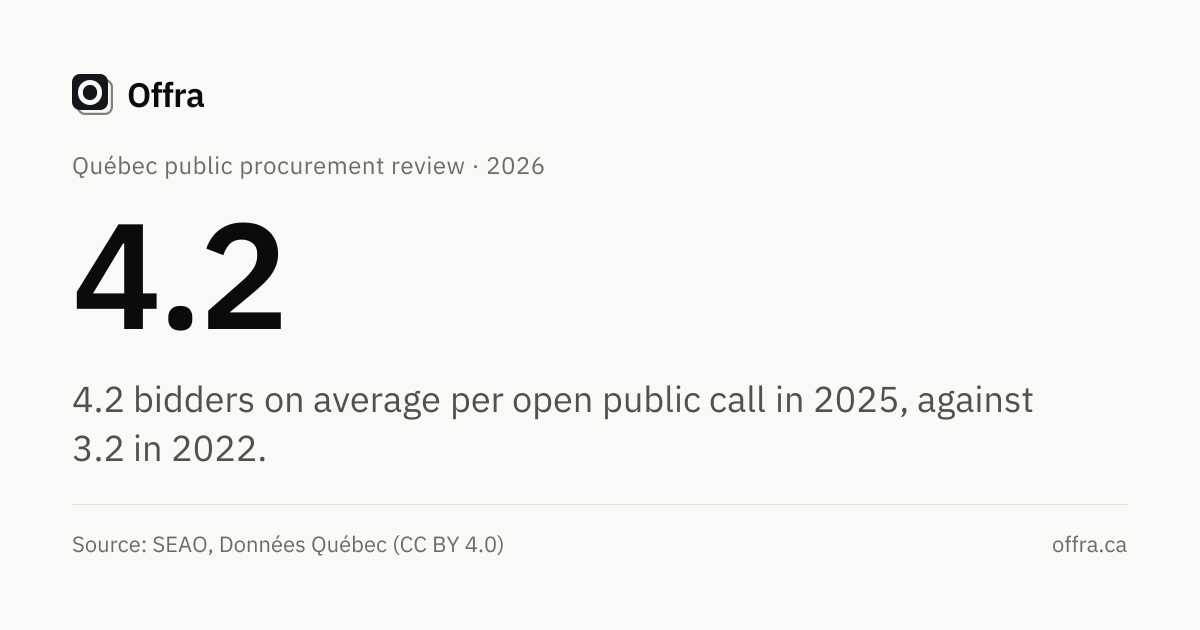
See the findingOpen calls closed in 2025: mean number of bidders.
See the findingConstruction work contracts from a public call, published up to 2022 and observed for at least four years: share whose final value is above the awarded amount.
See the findingAwarded construction open calls with a published estimate and a single award, one bidder: share where the contract exceeds the buyer's estimate.
See the finding01 — The threshold
Gré à gré contracts stop just under the threshold
Below the public-tender threshold, a public body may award a contract by gré à gré; from the threshold up, it must publish a call for tenders. Provincial bodies award 4.5 times as many gré à gré contracts just under the threshold as just above it, and municipal bodies 3.3 times as many. At a round amount with no legal meaning, the same ratio is only 1.2.
The wall follows the law. Each time the threshold moved, the wall moved with it, including in 2022, when municipal bodies adopted the new threshold nine months after provincial ones. In the zone just under the threshold there are 36% more gré à gré contracts than the surrounding trend predicts.
Above the threshold, bodies cite an exception the law provides: 16% of gré à gré contracts there cite that only one contractor is possible, against 0.7% just below, where the most common ground is an amount below the threshold (39%).
A gré à gré contract awarded below the threshold is lawful. This finding describes the rule's effect on the market; it says nothing about the reasons behind any one contract or any one body.
- Gré à gré contracts just under the threshold
- Gré à gré contracts, elsewhere
- Smooth trend with no threshold effect
Each contract is placed relative to its body's threshold on the award date, which lays every period on one axis.
See the data
| Bracket | Contracts | Smooth trend |
|---|---|---|
| −$45K → −$44K | 770 | 838 |
| −$44K → −$43K | 925 | 832 |
| −$43K → −$42K | 769 | 825 |
| −$42K → −$41K | 886 | 818 |
| −$41K → −$40K | 791 | 810 |
| −$40K → −$39K | 694 | 801 |
| −$39K → −$38K | 791 | 793 |
| −$38K → −$37K | 697 | 783 |
| −$37K → −$36K | 832 | 774 |
| −$36K → −$35K | 734 | 764 |
| −$35K → −$34K | 835 | 753 |
| −$34K → −$33K | 972 | 743 |
| −$33K → −$32K | 579 | 732 |
| −$32K → −$31K | 796 | 720 |
| −$31K → −$30K | 696 | 708 |
| −$30K → −$29K | 586 | 696 |
| −$29K → −$28K | 597 | 684 |
| −$28K → −$27K | 486 | 672 |
| −$27K → −$26K | 631 | 659 |
| −$26K → −$25K | 741 | 646 |
| −$25K → −$24K | 639 | 632 |
| −$24K → −$23K | 719 | 619 |
| −$23K → −$22K | 605 | 605 |
| −$22K → −$21K | 1,074 | 592 |
| −$21K → −$20K | 478 | 578 |
| −$20K → −$19K | 461 | 564 |
| −$19K → −$18K | 616 | 549 |
| −$18K → −$17K | 439 | 535 |
| −$17K → −$16K | 501 | 521 |
| −$16K → −$15K | 544 | 506 |
| −$15K → −$14K | 408 | 492 |
| −$14K → −$13K | 677 | 477 |
| −$13K → −$12K | 381 | 463 |
| −$12K → −$11K | 457 | 448 |
| −$11K → −$10K | 436 | 434 |
| −$10K → −$9K | 440 | 419 |
| −$9K → −$8K | 543 | 405 |
| −$8K → −$7K | 484 | 391 |
| −$7K → −$6K | 520 | 376 |
| −$6K → −$5K | 627 | 362 |
| −$5K → −$4K | 312 | 348 |
| −$4K → −$3K | 459 | 334 |
| −$3K → −$2K | 373 | 320 |
| −$2K → −$1K | 574 | 307 |
| −$1K → $0 | 503 | 293 |
| $0 → +$1K | 143 | 280 |
| +$1K → +$2K | 130 | 267 |
| +$2K → +$3K | 131 | 254 |
| +$3K → +$4K | 145 | 242 |
| +$4K → +$5K | 160 | 230 |
| +$5K → +$6K | 105 | 218 |
| +$6K → +$7K | 126 | 206 |
| +$7K → +$8K | 102 | 194 |
| +$8K → +$9K | 147 | 183 |
| +$9K → +$10K | 142 | 173 |
| +$10K → +$11K | 92 | 162 |
| +$11K → +$12K | 142 | 152 |
| +$12K → +$13K | 135 | 143 |
| +$13K → +$14K | 111 | 134 |
| +$14K → +$15K | 93 | 125 |
| +$15K → +$16K | 87 | 117 |
| +$16K → +$17K | 167 | 109 |
| +$17K → +$18K | 80 | 102 |
| +$18K → +$19K | 109 | 95 |
| +$19K → +$20K | 119 | 88 |
| +$20K → +$21K | 82 | 83 |
| +$21K → +$22K | 89 | 77 |
| +$22K → +$23K | 90 | 73 |
| +$23K → +$24K | 92 | 68 |
| +$24K → +$25K | 82 | 65 |
| +$25K → +$26K | 75 | 62 |
| +$26K → +$27K | 124 | 60 |
| +$27K → +$28K | 83 | 58 |
| +$28K → +$29K | 167 | 57 |
| +$29K → +$30K | 84 | 57 |
| +$30K → +$31K | 77 | 57 |
| +$31K → +$32K | 102 | 58 |
| +$32K → +$33K | 69 | 60 |
| +$33K → +$34K | 74 | 63 |
| +$34K → +$35K | 104 | 66 |
| +$35K → +$36K | 67 | 70 |
| +$36K → +$37K | 94 | 75 |
| +$37K → +$38K | 66 | 80 |
| +$38K → +$39K | 117 | 87 |
| +$39K → +$40K | 76 | 94 |
| +$40K → +$41K | 76 | 102 |
| +$41K → +$42K | 85 | 112 |
| +$42K → +$43K | 64 | 121 |
| +$43K → +$44K | 76 | 132 |
| +$44K → +$45K | 131 | 144 |
02 — Competition
Open public calls draw more bidders
An open public call closed in 2025 drew 4.2 bidders on average, against 3.2 in 2022. The share of single-bid calls went from 22% to 17%. In construction it halved, from 17% to 8.4%.
It is not a composition effect: many bodies started publishing in SEAO over the period, but among the 240 bodies that published every year, the decline is almost the same. The series starts in 2022: before then, the published bidder list does not measure the same thing.
Hollow column: incomplete year, read with care.
See the data
| Year | Calls | Single bid | Mean bidders |
|---|---|---|---|
| 2022 | 7,736 | 21.5% | 3.21 |
| 2023 | 12,989 | 22.0% | 3.37 |
| 2024 | 16,734 | 19.7% | 3.69 |
| 2025 | 15,162 | 16.7% | 4.25 |
| 2026 | 9,001 | 14.4% | 4.25 |
03 — What competition is worth
More bidders goes with prices under the estimate
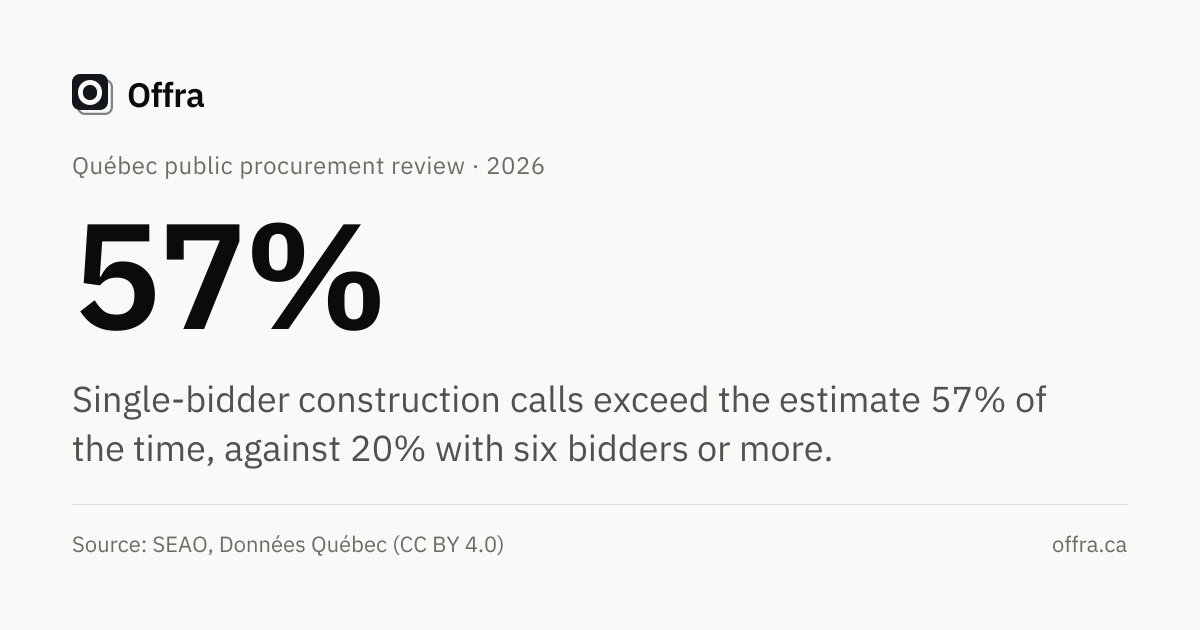
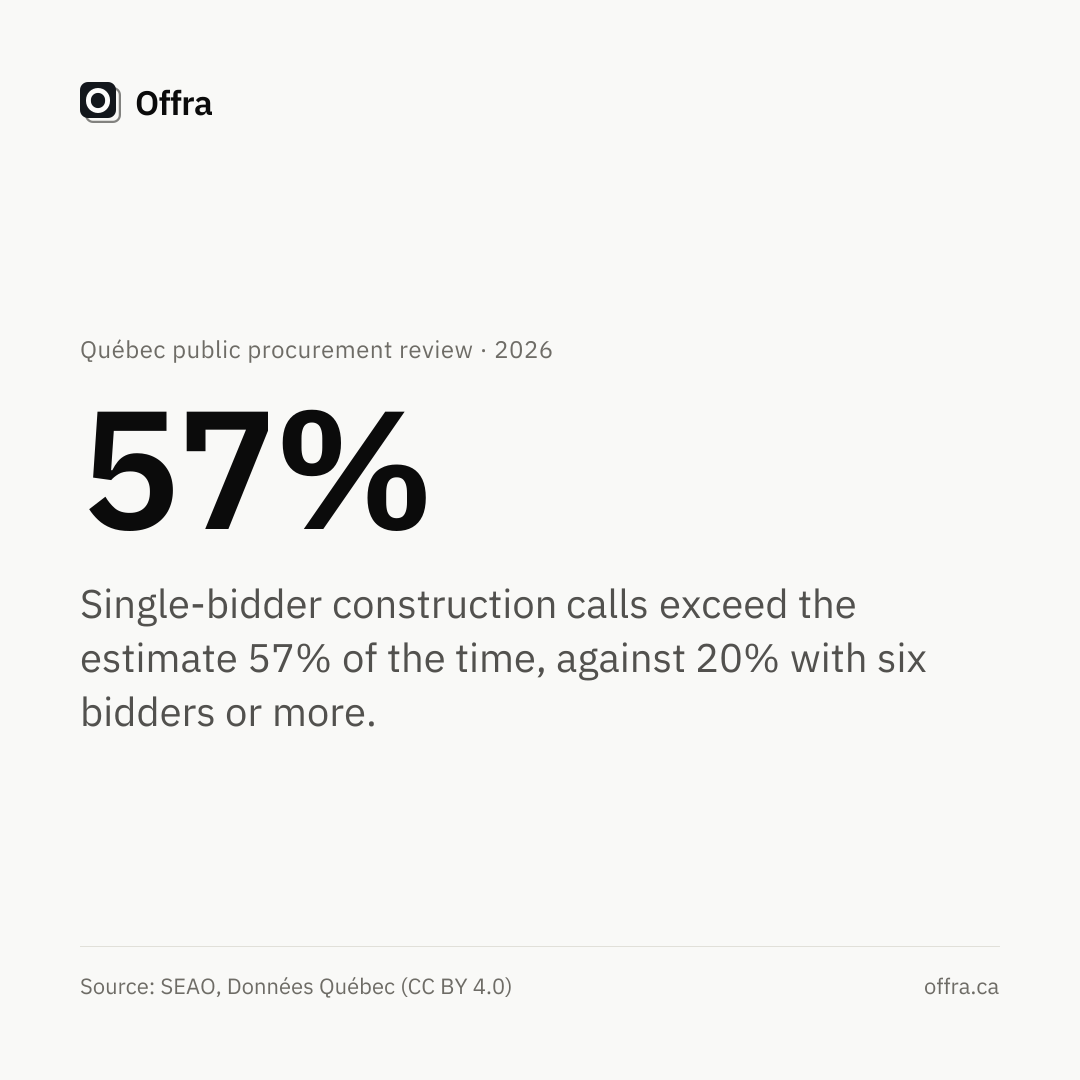
When a single bidder answers a construction call, the contract exceeds the buyer's estimate in 57% of cases. With six bidders or more, in 20%. The median contract goes from 105% to 83% of the estimate.
The same slope holds in services and goods. It is an association, not a demonstrated cause: a call that draws a single bidder may also be harder, more urgent or poorly estimated.
See the data
| Category · bidders | Contracts | Median contract / estimate | Above the estimate |
|---|---|---|---|
| Goods · 1 | 792 | 95% | 38% |
| Goods · 2 | 887 | 88% | 29% |
| Goods · 3 | 606 | 86% | 27% |
| Goods · 4 | 351 | 77% | 19% |
| Goods · 5 | 175 | 76% | 19% |
| Goods · 6+ | 245 | 74% | 12% |
| Services · 1 | 683 | 91% | 34% |
| Services · 2 | 984 | 81% | 26% |
| Services · 3 | 812 | 79% | 24% |
| Services · 4 | 551 | 75% | 19% |
| Services · 5 | 411 | 73% | 18% |
| Services · 6+ | 913 | 77% | 17% |
| Construction · 1 | 449 | 105% | 57% |
| Construction · 2 | 949 | 97% | 44% |
| Construction · 3 | 1,165 | 90% | 34% |
| Construction · 4 | 965 | 89% | 30% |
| Construction · 5 | 775 | 87% | 31% |
| Construction · 6+ | 1,579 | 83% | 20% |
04 — After the award
Half of construction contracts end above their awarded amount
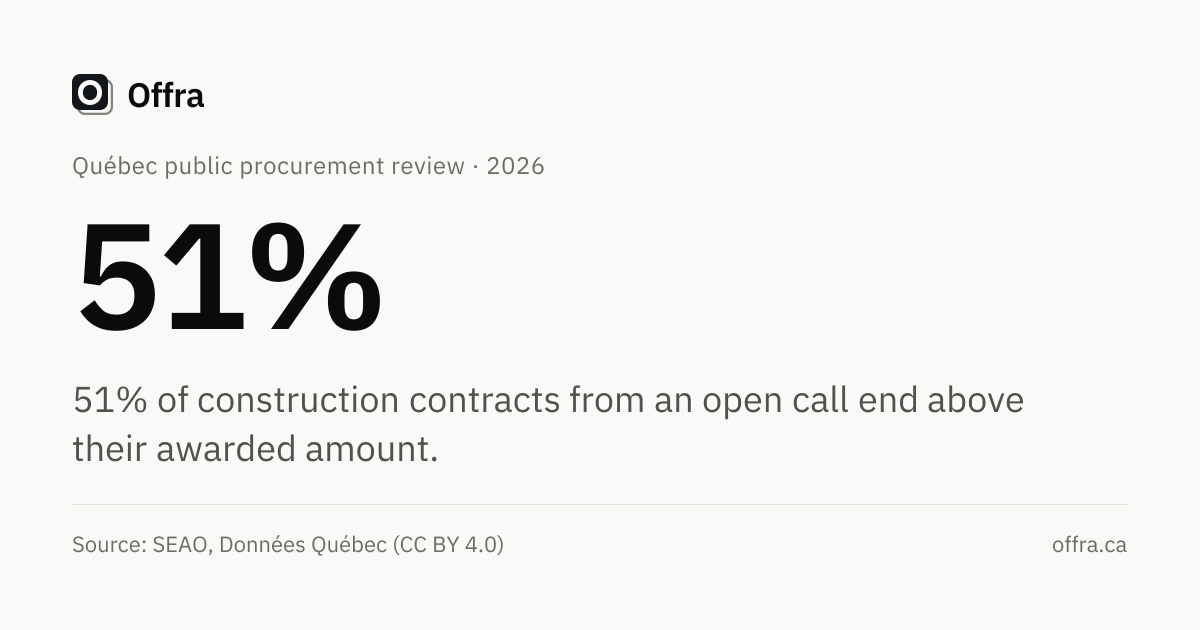
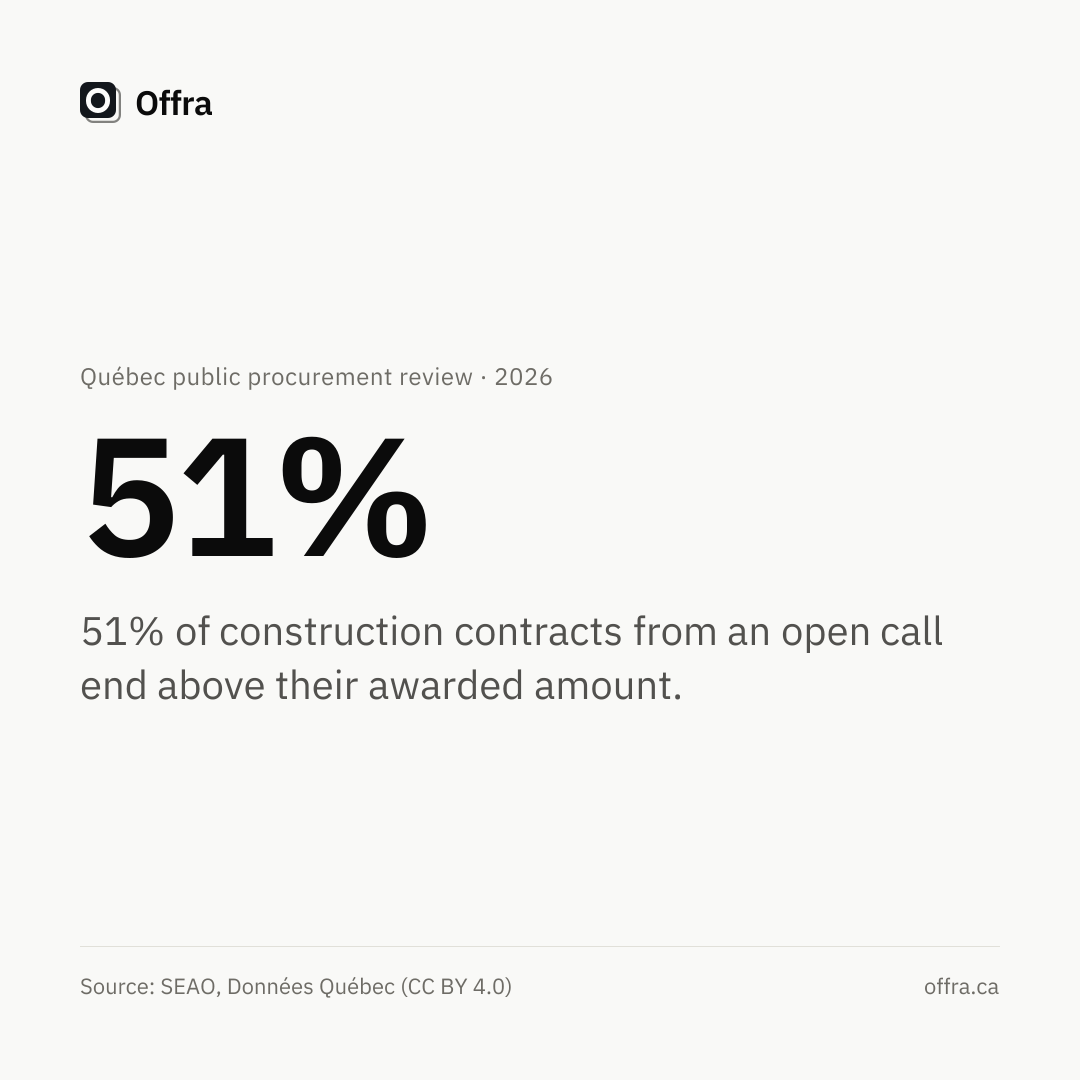
Among construction contracts from an open call, published up to 2022 and observed for at least four years, 51% end with a final value above the award, usually by a little: median at 107% of the award. In services it happens less often (39%) but by more: median at 147%.
A higher final value is not necessarily an overrun: it includes changes the body asked for. SEAO publishes a reason for each change, with no amount, and for 21% of them that reason is only an amendment or change-order number.
More recent contracts are not read: a change often arrives years after signature, and a recent contract would wrongly look unchanged.
- Construction51%median 107% when above
- Services39%median 147% when above
- Goods31%median 130% when above
See the data
| Category | Contracts | Above | By more than ten percent | Median when above |
|---|---|---|---|---|
| Construction | 18,788 | 51% | 18% | 107% |
| Services | 18,340 | 39% | 30% | 147% |
| Goods | 8,780 | 31% | 22% | 130% |
Only 55% of published changes name a cause, under the 70% bar set for showing their breakdown.
05 — Gré à gré
Many contracts, few dollars
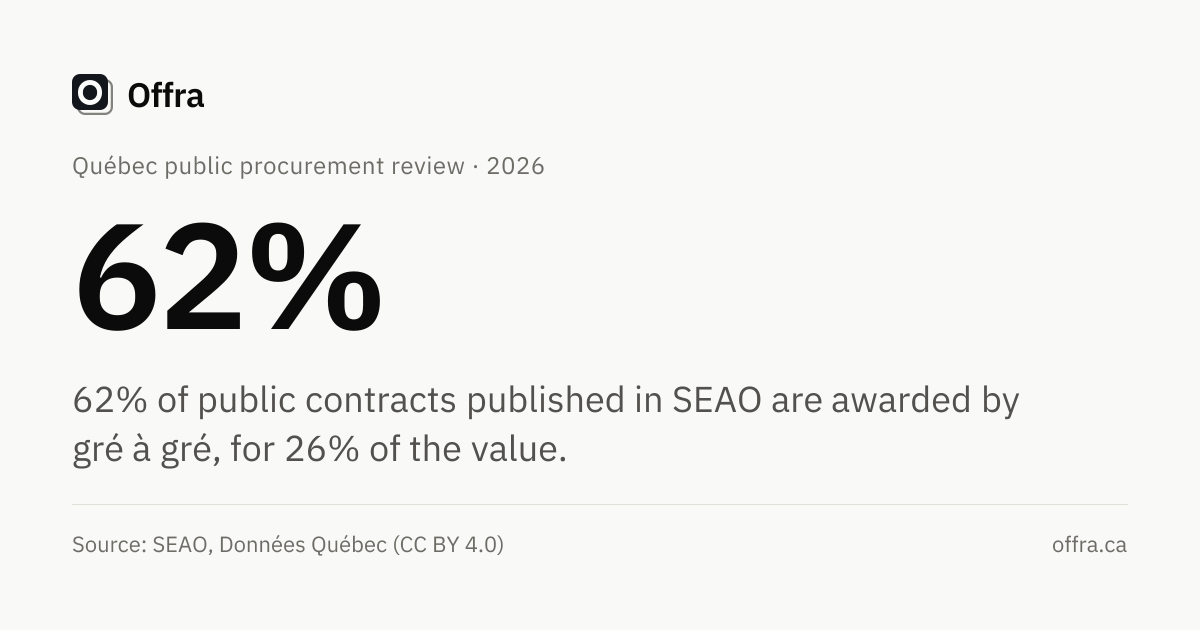
In 2025, 62% of awarded processes published in SEAO were awarded by gré à gré, but they account for only 26% of the awarded value. Since 2021 the share has ranged between 62% and 70%: it is not rising.
Gré à gré is provided for by law below the public-tender threshold and, above it, for exceptions such as urgency or a single possible supplier. Among the 419 bodies that published every year, the share is of the same order.
Hollow column: incomplete year, read with care.
See the data
| Year | Awarded processes | Gré à gré, by count | Gré à gré, by value |
|---|---|---|---|
| 2021 | 45,327 | 61.7% | 24.0% |
| 2022 | 45,284 | 69.8% | 35.9% |
| 2023 | 52,890 | 66.5% | 22.2% |
| 2024 | 57,423 | 61.6% | 16.8% |
| 2025 | 53,017 | 62.3% | 26.0% |
| 2026 | 27,242 | 60.2% | 13.8% |
06 — Public buyers
Gré à gré depends first on the type of buyer
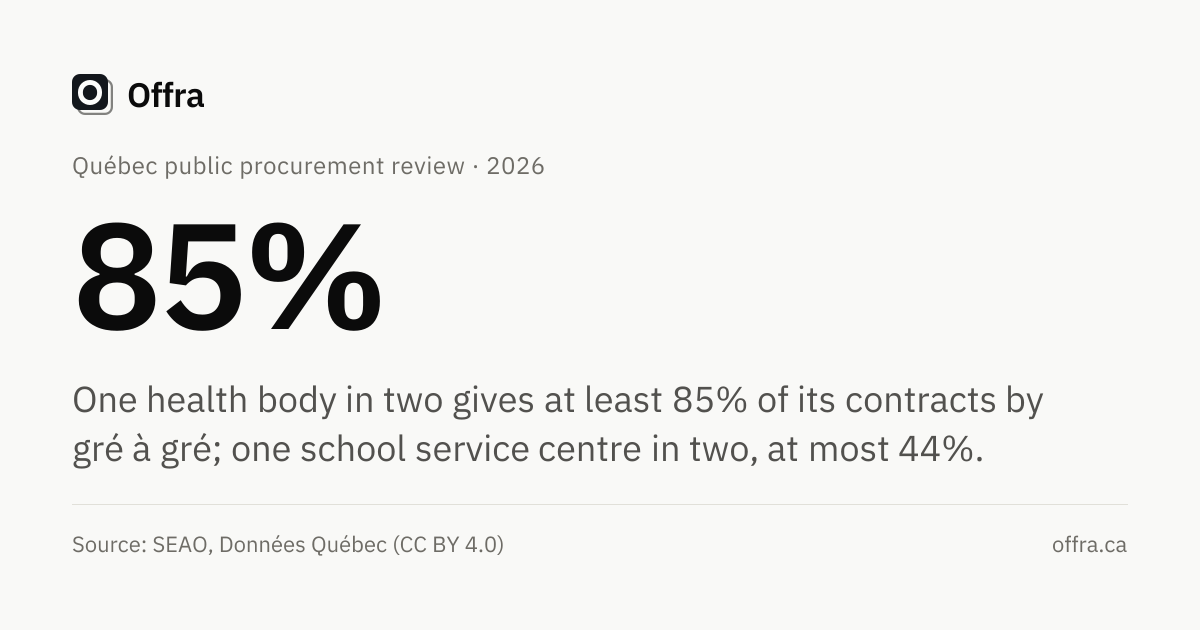
One health body in two gives at least 85% of its contracts by gré à gré; one school service centre in two, at most 44%.
Within one type, the gaps are wide. Among municipalities, one in ten gives less than 21% of its contracts by gré à gré, and one in ten more than 85%.
The same gap just under the public-tender threshold. Of its gré à gré contracts near the threshold, the median municipality places 10% in the last ten percent under it; one municipality in ten places 20% or more. A gré à gré contract awarded below the threshold is lawful: the gap describes ways of buying, not any body's conduct.
The single bid varies less from one type to another: its median is 17% among municipalities as among health bodies (17%).
No body is named. Each point in the charts is a public body, without its name, and a type of buyer is shown only when it counts enough bodies that no point singles one out.
Processes awarded from 2022 to 2025. Each point is a public body with at least 40 awarded processes, unnamed. A type is shown only from 10 bodies; Crown corporations, other public bodies have too few. The 39 bodies whose type could not be established are left out.
See the data
| Type of buyer | Bodies | 10th percentile | Median | 90th percentile |
|---|---|---|---|---|
| Municipalities | 315 | 21% | 64% | 85% |
| Health and social services | 40 | 72% | 85% | 93% |
| School service centres | 70 | 19% | 44% | 65% |
| CEGEPs | 48 | 41% | 59% | 83% |
| Universities | 24 | 49% | 76% | 92% |
| Departments and agencies | 95 | 51% | 74% | 90% |
Processes awarded from 2022 to 2025. Each point is a public body with at least 20 gré à gré contracts near the threshold, unnamed. A type is shown only from 10 bodies; Crown corporations, other public bodies have too few. The 39 bodies whose type could not be established are left out.
See the data
| Type of buyer | Bodies | 10th percentile | Median | 90th percentile |
|---|---|---|---|---|
| Municipalities | 133 | 4% | 10% | 20% |
| Health and social services | 38 | 7% | 11% | 18% |
| School service centres | 40 | 1% | 7% | 14% |
| CEGEPs | 25 | 1% | 8% | 16% |
| Universities | 19 | 7% | 8% | 11% |
| Departments and agencies | 73 | 5% | 12% | 23% |
Processes awarded from 2022 to 2025. Each point is a public body with at least 20 awarded open calls, unnamed. A type is shown only from 10 bodies; Crown corporations, other public bodies have too few. The 39 bodies whose type could not be established are left out.
See the data
| Type of buyer | Bodies | 10th percentile | Median | 90th percentile |
|---|---|---|---|---|
| Municipalities | 184 | 6% | 17% | 30% |
| Health and social services | 33 | 8% | 17% | 32% |
| School service centres | 69 | 6% | 14% | 27% |
| CEGEPs | 31 | 4% | 10% | 21% |
| Universities | 21 | 7% | 16% | 29% |
| Departments and agencies | 64 | 8% | 17% | 26% |
07 — Transparency
Prices are published; the reasons for changes much less
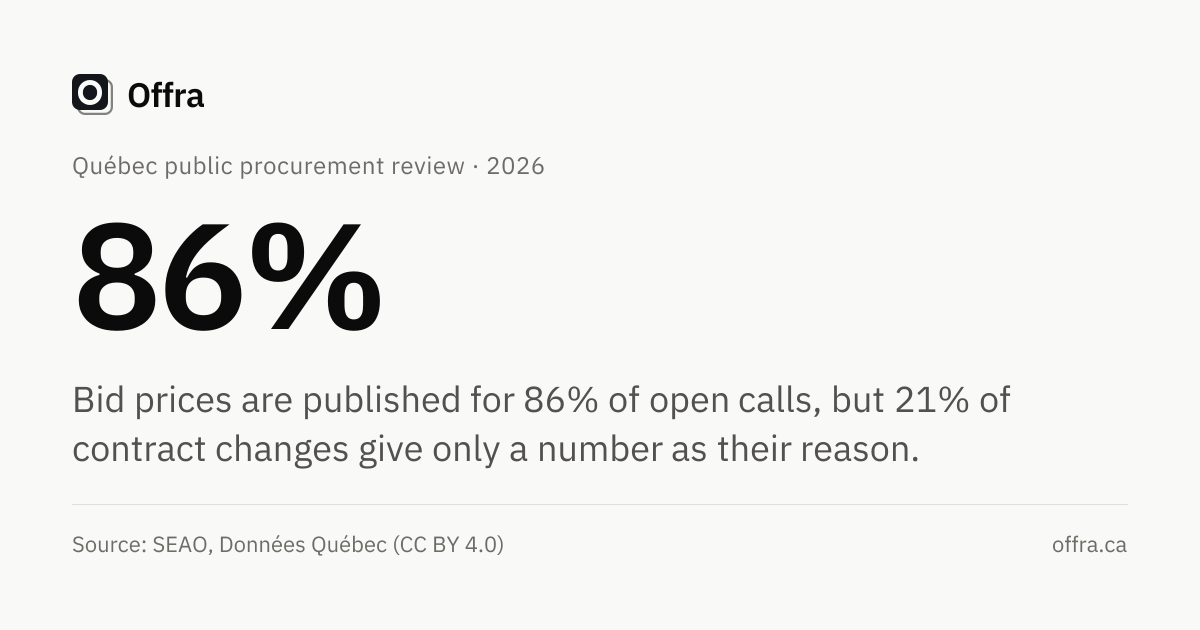
Bid prices are published for 86% of awarded open calls, but for only 70% in services. The buyer's estimate is published more and more often: 37% of calls in 2024, 44% in 2025.
The weak point is elsewhere: for 21% of contract changes, the only published reason is an amendment or change-order number.
- Goods95%
- Services70%
- Construction98%
See the data
| Year | Awarded calls | Prices published | Estimate published |
|---|---|---|---|
| 2021 | 10,400 | 89.7% | — |
| 2022 | 6,853 | 89.4% | — |
| 2023 | 10,731 | 90.0% | — |
| 2024 | 14,666 | 88.2% | 36.5% |
| 2025 | 13,727 | 85.9% | 44.2% |
| 2026 | 7,718 | 87.6% | 51.5% |
The rise in stated legal grounds may follow a change in SEAO's form rather than in practice; it is not published until that is checked.
08 — The amounts
What a public contract amounts to
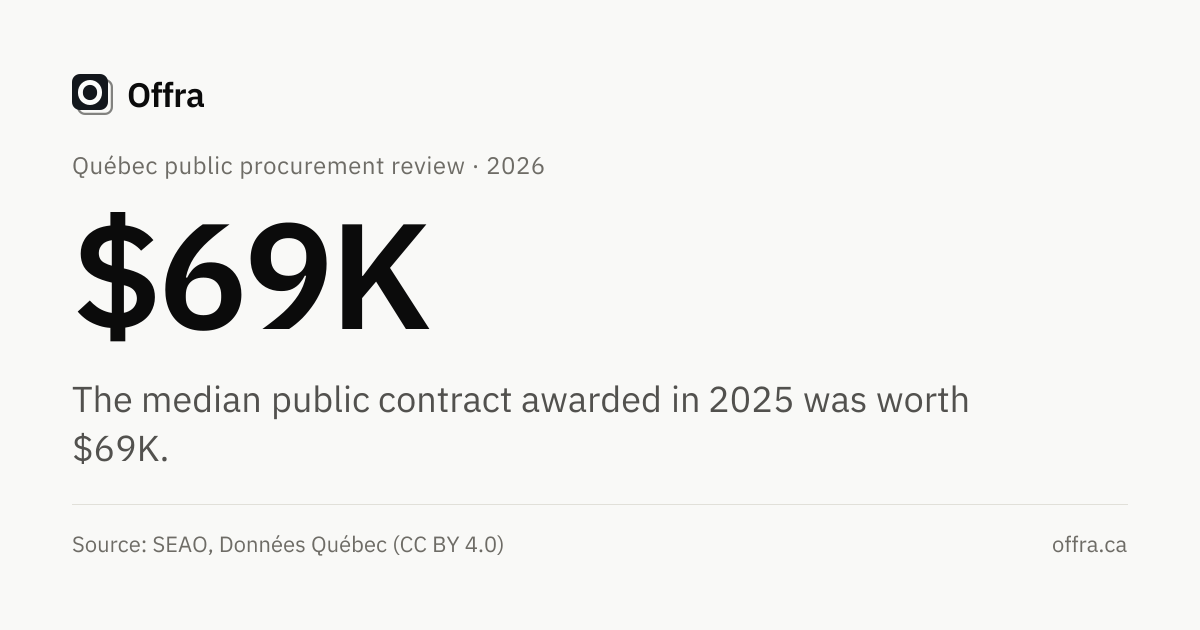
The median contract awarded in 2025 was worth $69K. From 2023 to 2025, between $36.1B and $41.2B was awarded each year, not counting the ten largest contracts, which weigh up to 20% of a year.
Awarded is not spent: a framework agreement records its ceiling, which may never be reached. These amounts are an order of magnitude, not a trend: from one year to the next, a few very large contracts are enough to move the total.
| Year | Contracts | Median contract (2025 $) | Total without the ten largest | Share of the ten largest |
|---|---|---|---|---|
| 2021 | 45,327 | $76K | $30.8B | 14% |
| 2022 | 45,284 | $66K | $27.5B | 19% |
| 2023 | 52,890 | $67K | $40.5B | 16% |
| 2024 | 57,423 | $72K | $41.2B | 20% |
| 2025 | 53,017 | $69K | $36.1B | 16% |
In constant 2025 dollars (Québec CPI, Statistique Canada, 18-10-0004-01). The 45 largest contracts, and those furthest from their estimate, were checked one by one. One of them, whose published amount is plainly wrong, is left out of every figure.
09 — The regions
Competition from one region to the next
The populated corridor, enlarged — eight of the ten most active regions fit inside this frame. The regions in it are clickable, as on the map.
- 0–14
- 15–16
- 17–19
- 20–26
- 27–33
- 0–45
- 46–55
- 56–60
- 61–63
- 64–74
- 0–63
- 64–65
- 66–67
- 68–68
- 69–94
Quantile scale: each step holds a comparable number of regions.
Click a region to open its report.
Territorial boundaries: Données Québec, « Découpages administratifs » (SDA) 1/100 000, CC-BY 4.0, simplified for display. Labrador is outside Quebec and appears as a notch; the Côte-Nord and the Gaspésie extend over their gulf waters, as in the official boundaries.
| Region | Calls | Single bid | Bidders | Gré à gré | Median contract |
|---|---|---|---|---|---|
| Bas-Saint-Laurent | 908 | 21% | 3.0 | 61% | $67K |
| Saguenay–Lac-Saint-Jean | 1,139 | 19% | 3.3 | 45% | $65K |
| National Capital | 3,688 | 17% | 4.1 | 69% | $68K |
| Mauricie | 1,012 | 20% | 3.7 | 51% | $74K |
| Estrie | 1,510 | 18% | 3.5 | 63% | $68K |
| Montréal | 5,711 | 16% | 4.3 | 74% | $63K |
| Outaouais | 1,212 | 21% | 3.4 | 46% | $83K |
| Abitibi-Témiscamingue | 755 | 30% | 2.7 | 42% | $69K |
| Côte-Nord | 692 | 33% | 2.8 | 54% | $69K |
| Nord-du-Québec | 446 | 27% | 3.1 | 64% | $66K |
| Gaspésie-Iles-de-la-Madeleine | 497 | 32% | 2.7 | 61% | $57K |
| Chaudière-Appalaches | 1,438 | 18% | 3.9 | 56% | $64K |
| Laval | 736 | 12% | 4.9 | 65% | $94K |
| Lanaudière | 1,331 | 14% | 4.4 | 61% | $64K |
| Laurentides | 1,874 | 15% | 4.1 | 61% | $64K |
| Montérégie | 3,861 | 15% | 4.2 | 62% | $69K |
| Centre-du-Québec | 900 | 15% | 4.0 | 42% | $66K |
| All of Québec | 31,896 | 18% | 4.0 | 62% | $69K |
Open calls closed, notices naming this region only. Share of those calls that drew a single bid. Mean number of bidders on those calls. Share of awarded processes given by gré à gré. Median value of an awarded contract. Years 2024–2025. The gap between regions comes mostly from distance and market size; it says nothing about how bodies or firms behave.
10 — The sectors
What is bought, sector by sector
| Sector | Contracts, 2024–2025 | Rank, 2021–2022 → 2024–2025 | Median contract | Gré à gré | Single bid |
|---|---|---|---|---|---|
| Professional and administrative services | 13,068 | 1 → 1 | $52K | 82% | 20% |
| IT and telecommunications | 13,021 | 2 → 2 | $66K | 77% | 19% |
| Maintenance, snow removal and facility operations | 12,595 | 3 → 3 | $65K | 59% | 20% |
| Building construction* | 11,980 | — | $107K | 39% | 10% |
| Architecture, engineering and inspection | 10,345 | 5 → 4 | $56K | 69% | 14% |
| Health and social services | 8,920 | 4 → 5 | $72K | 89% | 23% |
| Supplies, materials and products | 8,847 | 6 → 6 | $55K | 55% | 21% |
| Equipment, machinery and instruments | 8,367 | 8 → 7 | $58K | 61% | 32% |
| Civil works and roads* | 6,349 | — | $373K | 19% | 8% |
| Vehicles and transportation | 6,160 | 9 → 8 | $75K | 52% | 35% |
| Other and undetermined | 4,484 | 7 → 9 | $66K | 89% | 32% |
| Environment and natural resources | 3,735 | 10 → 10 | $70K | 50% | 18% |
| Other construction work* | 710 | — | $197K | 20% | 10% |
* Not compared across periods: in 2024 SEAO retired its « Autres travaux de construction » category and moved those contracts into building and civil works. Sectors group SEAO's own categories; each sector page lists them. The single-bid share is on awarded open calls.
Try Offra
See every tender with these figures
Free, no card: open notices from SEAO, CanadaBuys and the municipal portals we follow, filterable by what each notice demands, plus a saved search with an email alert. Your first submission is on us: every Business feature on one tender, with a card that is verified and never charged. or subscribe directly
Press and data
The images and files below may be reused with the source cited: “Offra, from SEAO data (Données Québec)”.
One image per finding
The data, as CSV
- statistiques.csv — Every quoted figure, with its definition and the query that produced it
- seuil-periodes.csv — The threshold: each legal period, the below/above ratio and the control
- seuil-histogramme.csv — The threshold: gré à gré contracts by distance to the threshold, and the smooth trend
- concurrence.csv — Competition: open calls by year and category
- valeur-concurrence.csv — What competition is worth: contract against estimate by number of bidders
- depassements.csv — After the award: contracts ending above their awarded amount
- gre-a-gre.csv — Gré à gré: share of awarded processes, by count and by value
- transparence.csv — Transparency: bid prices and estimate published, awarded open calls
- montants.csv — The amounts: median contract and totals without the ten largest, constant dollars
- regions.csv — The seventeen regions: competition, gré à gré and median contract
- secteurs.csv — The sectors: volume, rank, median contract, gré à gré and single bid
- organismes-par-type.csv — Public buyers by type: median and spread, no body named
- LISEZMOI.txt — source, licence and edition status
Method
How we measured
All data come from SEAO, the Québec government's electronic tendering system, published as open data on Données Québec. This edition reads processes awarded from January 1, 2021 to June 30, 2026, from a copy of the data as of the file of September 20, 2026. Every figure carries the sentence saying what it covers, and the file statistiques.csv lists each one with its definition, its count and the name of the query that produced it.
The populations
- Processes published in SEAO whose award, dated 2021-01-01 to 2026-06-30, totals $40,000 to $250,000, every procurement method included. (overview_threshold.sql)
- Contracts published in SEAO whose award and contract both carry an amount, all years; the overview reads only those observed for at least four years. (integrity_overrun.sql)
- Contract changes published in SEAO, all years, each counted once, with the category of the contract changed. (overview_amendment_reasons.sql)
- Processes published in SEAO with a priced award dated 2021-01-01 to 2026-06-30, every procurement method included. (overview_awards.sql)
- Open public calls for tenders published in SEAO whose bidding period closed 2021-01-01 to 2026-06-30 and that received at least one bid. (overview_competition.sql)
The public-tender thresholds
| Regime | In force from | Threshold |
|---|---|---|
| Provincial bodies | in force on January 1, 2021 | $105,700 |
| Provincial bodies | January 1, 2022 | $121,200 |
| Provincial bodies | January 1, 2024 | $133,800 |
| Provincial bodies | January 1, 2026 | $139,000 |
| Municipal bodies | in force on January 1, 2021 | $105,700 |
| Municipal bodies | October 7, 2022 | $121,200 |
| Municipal bodies | January 1, 2024 | $133,800 |
| Municipal bodies | January 1, 2026 | $139,000 |
Transit authorities, which SEAO files with municipal bodies, contract under their own statutes and are left out of the threshold analysis. So are federal bodies.
Corrections and replies
Each edition is dated. Its figures change only through an erratum published on this page, with the old value, the new one and the reason. A public body or a firm that spots an error can write to us; a public body's reply is published as is.
Sources: SEAO, Données Québec (CC BY 4.0 licence). Consumer Price Index: Statistics Canada, table 18-10-0004-01 (Open Government Licence — Canada). Measurement and code: Offra (3c62594).